First steps in the UI
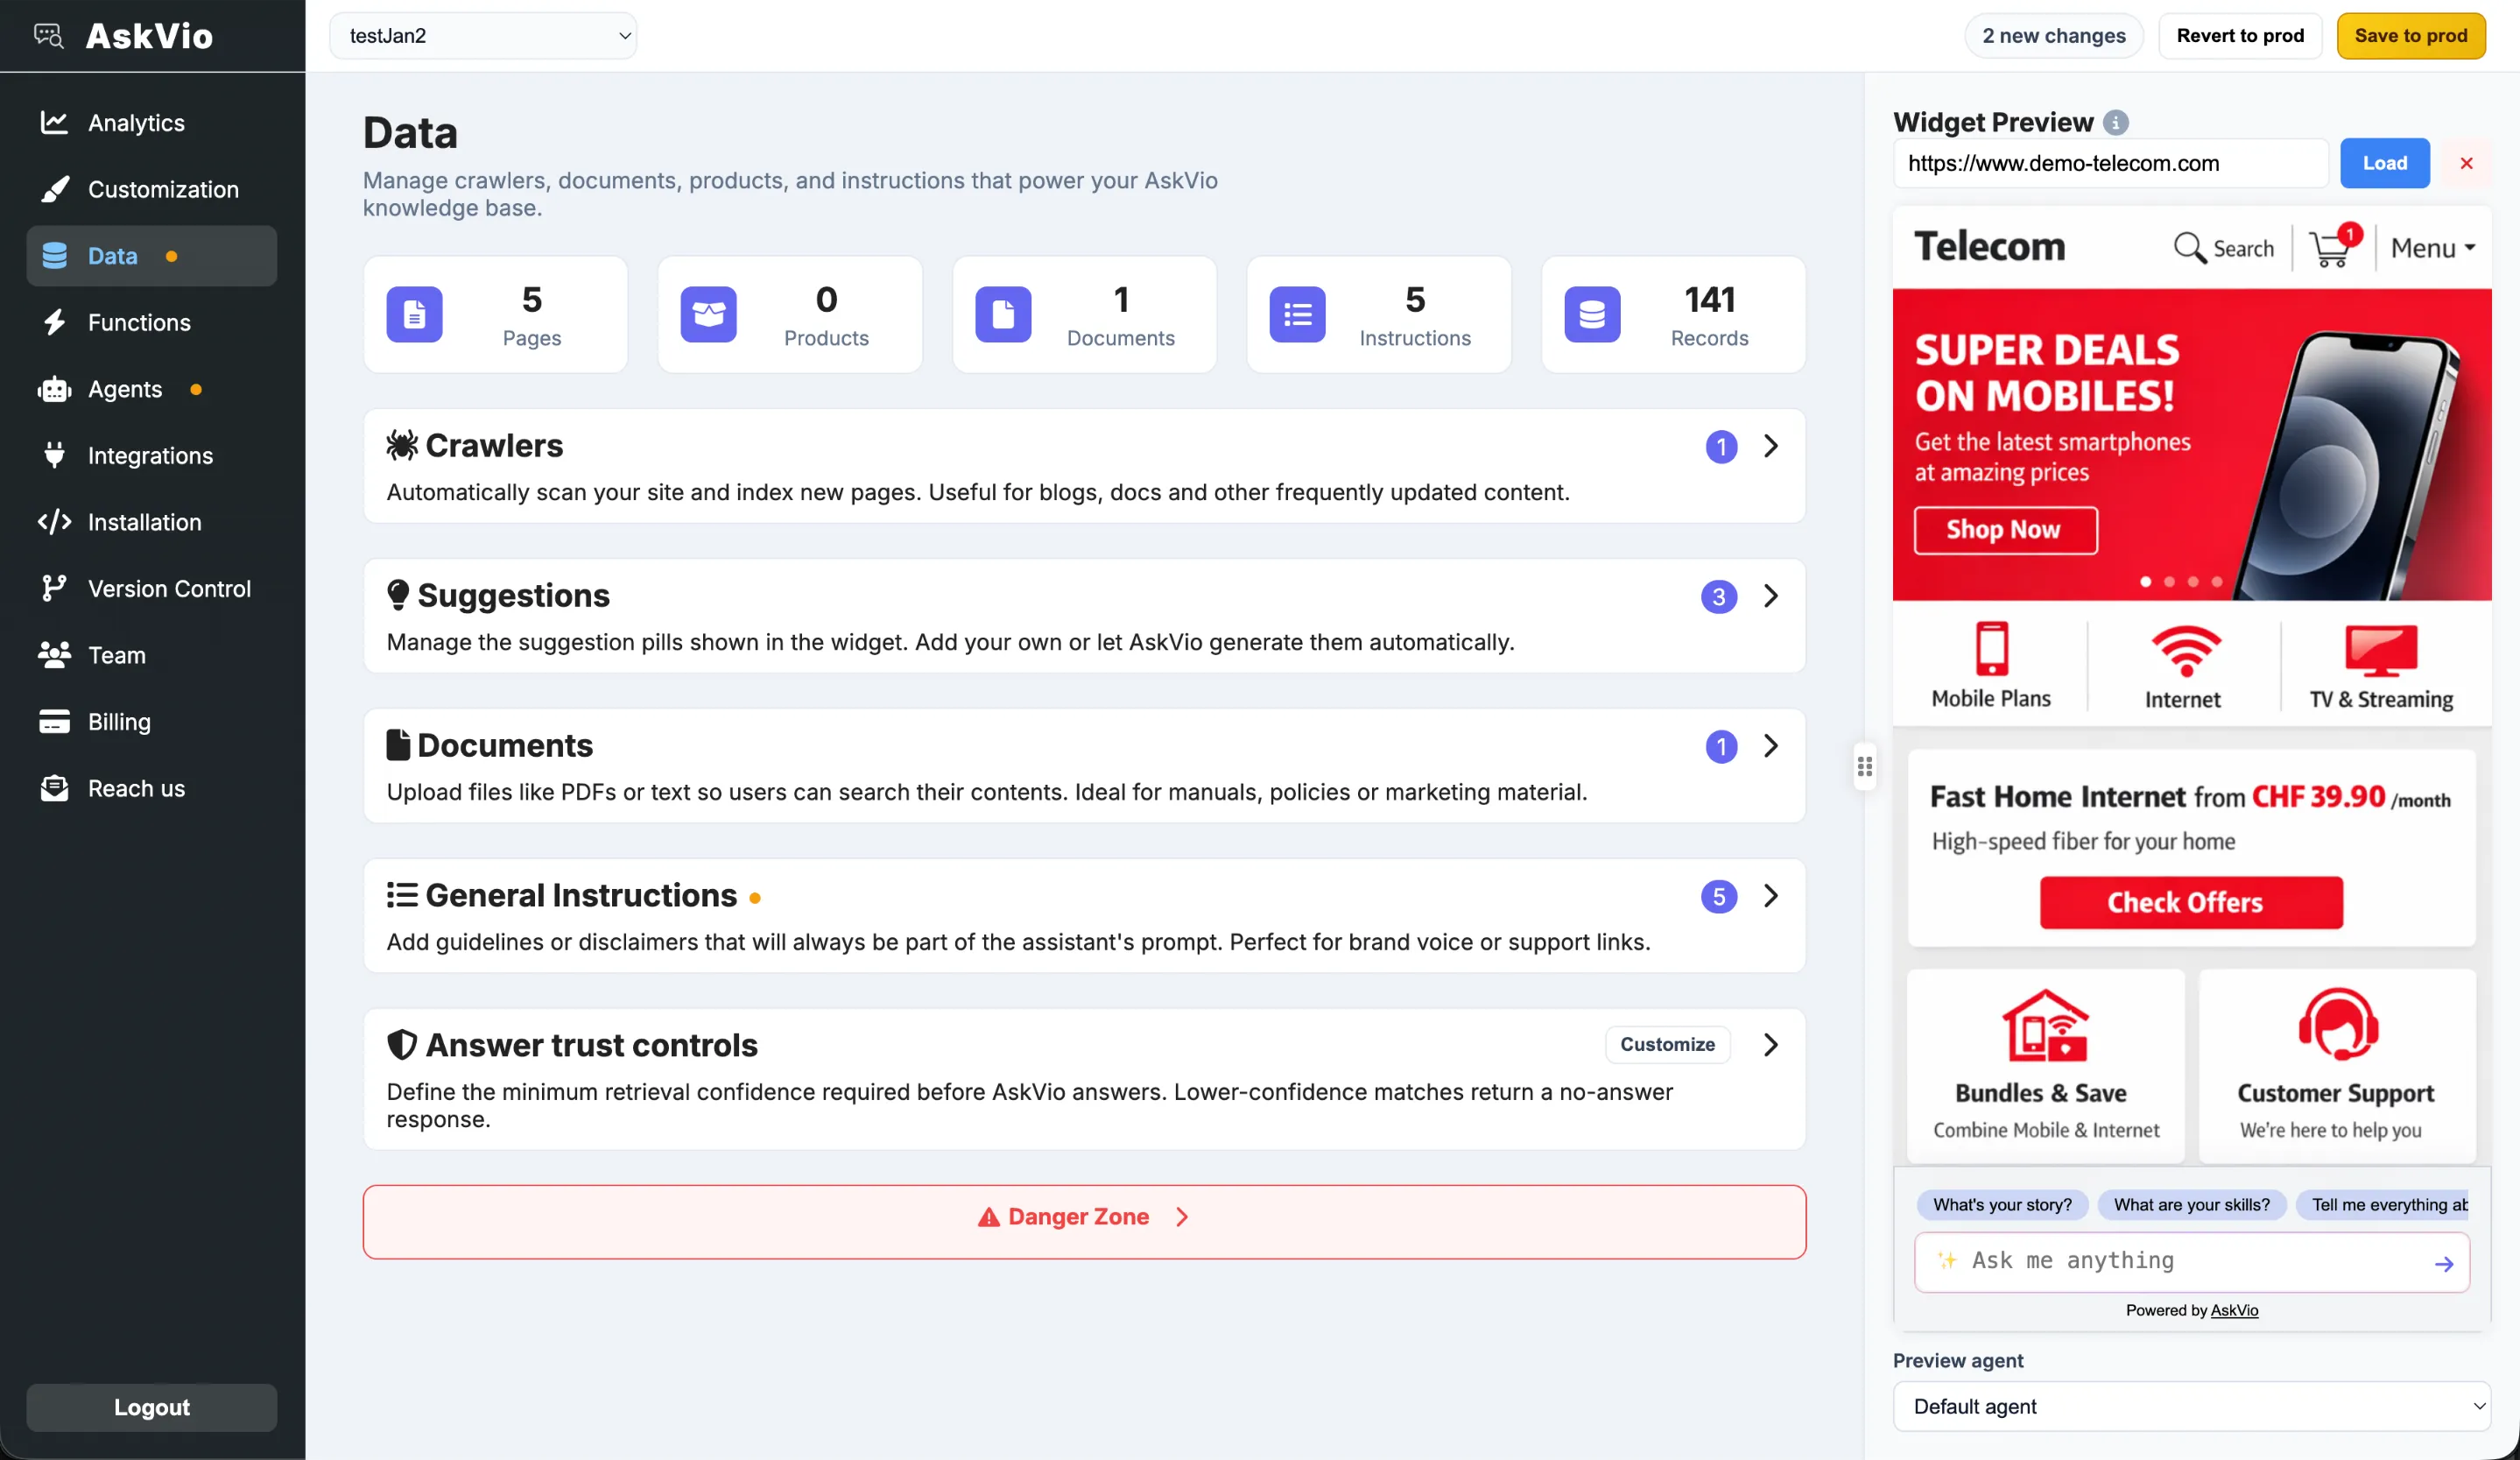
The dashboard is organized around a left navigation menu and a top release bar. New customers should first understand where day-to-day tasks happen:
- Top bar: account selector, pending changes indicator, Revert to prod, and Save to prod.
- Left menu: Analytics, Customization, Data, Functions, Agents, Integrations, Installation, Version Control, Team, Billing, Reach us.
- Yellow change dot: marks settings or resources changed in test but not yet published to production.
| Section | Best use |
|---|---|
| Analytics | Track messages, engagement, response quality, trends, and click behavior. |
| Customization | Match colors, radius, layout, and interaction style to your brand. |
| Data | Crawl URLs, manage uploaded docs, and control answer trust behavior. |
| Functions / Agents | Add user-triggered actions and specialized assistant personas. |
| Integrations | Connect services such as Google Analytics. |
| Installation | Copy embed code, configure domains, and fetch API key. |
| Version Control | Browse saved snapshots and restore previous tested configurations. |
| Team / Billing | Invite members, view usage, and manage subscriptions. |