
Failed Intent Rate: The KPI Your GA4 Dashboard Is Missing
GA4 tracks what your visitors do: pages viewed, events fired, conversions recorded. It cannot track what they wanted but could not get. That gap has a name — Failed Intent Rate — and for anyone who cares about measurement accuracy, it is the most important number that no standard analytics stack currently surfaces. This post defines it, explains why traditional analytics structurally cannot capture it, and shows you how to make it actionable today.
The gap in your analytics stack
The standard web analytics funnel is built on behavioral signals. A user arrives, clicks, scrolls, fills a form, and exits. Every one of those actions leaves a trace. GA4 captures it, processes it into events, builds it into funnels, and hands it back to you as a dashboard.
But there is an entire category of user experience that behavioral signals cannot represent: what a visitor wanted and could not find.
Consider the following four scenarios. All four users arrive on an e-commerce homepage. All four bounce after 45 seconds. From a GA4 perspective, they are identical — four sessions, four exits, zero conversions.
Each of these users represents a different problem with a different fix. User A is a navigation problem. User B is a catalog gap. User C is a content gap. The bounce rate tells you none of this. GA4 records the exit but is blind to the intent that preceded it.
This is not a GA4 limitation specifically. It is a structural limitation of behavioral analytics. The entire paradigm is built on observing actions, not understanding desires. As long as your primary analytics tool lives in that paradigm, a meaningful slice of your customer reality remains invisible.
Failed Intent Rate is the metric that starts to close that gap.
Defining Failed Intent Rate
Failed Intent Rate (FIR) is the percentage of user interactions in which a visitor expressed a need — through a direct question, a product search, or a conversational query — and received either no useful response or a response below a meaningful confidence threshold.
The metric has two independent components, and it is worth tracking them separately because the remediation path is different for each.
- Content FIR — the AI returned an answer, but with low confidence. The content exists (or partially exists) on your site, but not well enough for the AI to answer with certainty. Root cause: incomplete documentation, outdated copy, missing FAQs.
- Catalog FIR — the user asked for a product or category that produced no match in your indexed catalog. The content does not exist because the product does not exist. Root cause: catalog gaps, missing SKUs, or a product line you have not yet launched.
The combined FIR gives you a single number to track over time. The split gives you two separate action queues.
Important distinction: FIR is not the same as bounce rate, exit rate, or task completion rate. Those metrics measure behavior after the fact. FIR measures the success or failure of an intent expressed in natural language — the most direct signal of user desire available.
Why GA4 structurally cannot measure it
This is worth dwelling on, because many practitioners assume the answer is somewhere in their current stack if they just look hard enough. It is not, and here is why.
GA4 is built on behavioral events
GA4's data model is event-based. Every data point is an action a user took: page_view, scroll, click, purchase. What it cannot capture is the cognitive state that preceded the action. When a user bounces from a product page, GA4 records the exit event. It does not record "user was looking for size XL and it was not available."
Site search only covers search-bar interactions
GA4's internal site search tracking (view_search_results) captures queries typed into a traditional site search bar. This covers one interaction mode out of many. It misses users who: asked a support chatbot, navigated via category menus, used product filters, or simply read product descriptions and left. The site search box is an opt-in mechanism. Most intent signals never pass through it.
Even for users who do use site search, GA4 shows you the query but not the outcome. "Did the search return a useful result?" is not a GA4 measurement. You can build this yourself using custom events, but it requires instrumentation effort and does not generalize across sites.
Zero-party intent data is not in the behavioral layer
The most accurate signal of user intent is the user stating their intent in their own words. A conversational query — "do you have a winter jacket in XL for under €100?" — contains product type, size, season, and price range in a single sentence. No behavioral event captures this level of specificity. Even with advanced machine learning applied to clickstream data, you cannot reliably reverse-engineer that intent from the sequence of pages visited.
| Capability | GA4 + Site Search | Heatmaps | Exit Surveys | AI Chat + FIR |
|---|---|---|---|---|
| Records user behavior | Yes | Yes | Partial | Yes |
| Captures user intent in natural language | No | No | Partial (open-field) | Yes |
| Identifies content gaps specifically | No | No | Qualitative only | Yes, with clusters |
| Identifies catalog gaps specifically | No | No | No | Yes, with similarity scores |
| Runs continuously without user recruitment | Yes | Yes | No | Yes |
| Quantified as a rate over time | Exit rate only | No | No | Yes — FIR |
| First-party, cookieless | Partial (cookieless mode) | Requires JS tracking | Yes | Yes |
The table above is not an argument against GA4. GA4 is irreplaceable for traffic analysis, funnel measurement, and attribution. The argument is that GA4 and FIR measure fundamentally different things and are therefore complementary, not competitive. You need both.
The three types of failed intent
Once you start collecting FIR data, you will find that failed queries cluster into three distinct categories. Treating them as a single bucket obscures the different actions required.
The answer exists but isn't documented
Your return policy is real. Your shipping terms exist. Your integration supports that use case. But the AI could not find it because the information is buried in a PDF, missing from the help center, or on a page the crawler has not indexed yet.
The product does not exist in your range
The user is asking for something you do not carry. The AI searched your indexed product catalog and found nothing with sufficient similarity. This is real demand signal for a product you do not yet sell.
Content exists but is too thin to answer well
Your documentation covers the topic at a surface level but lacks the detail needed for a confident answer. The AI found partial matches but cannot synthesize a complete response. This points to content depth issues, not missing content.
The remediation for each type is different:
Content Gap: write and publish the missing content
Add a FAQ entry, publish a help center article, or update your returns page. Once the content exists, trigger a recrawl in AskVio. The confidence score for that query cluster will rise. This is the fastest loop in FIR remediation — typically resolved within 48 hours of publishing.
Catalog Gap: escalate to merchandising
This is a business intelligence signal, not a content task. The query data — including how many distinct visitors asked, the frequency, and the closest existing match — should be handed directly to the product or buying team. You are looking at real demand evidence, not guesswork.
Confidence Gap: expand and deepen existing content
Find the existing page or section that partially answers the query. Add more detail, add a structured FAQ block, add examples. Thin content that surfaces at mid-confidence is almost always more valuable to improve than starting from scratch.
Benchmarks: what does a healthy FIR look like?
FIR is a relatively new metric, and industry-wide benchmarks are still forming. Based on patterns observed across AskVio-powered sites and published research on AI search confidence distributions, the following ranges are a practical starting point.
| FIR Range | Status | Typical cause | Priority action |
|---|---|---|---|
| < 10% | Excellent | Well-documented site, comprehensive catalog, active content maintenance | Monitor for emerging gaps — use Trending Topics to catch new query clusters early |
| 10% – 25% | Good | Most content covered, some thin areas or seasonal catalog gaps | Work through the top-10 failed query clusters — quick wins available |
| 25% – 45% | Needs work | Large content surface with patchy coverage, or a catalog that changes faster than documentation is updated | Prioritise by volume. Content gaps are fastest to fix. Flag catalog gaps to buying team. |
| > 45% | Critical | Widget deployed on a site with insufficient crawl coverage, or a product range with poor structured data | Review crawl depth and scope first. Increase crawled pages, re-index, check if key pages are excluded. |
Important context: FIR is sensitive to the confidence threshold you set. A lower threshold means more queries are flagged as "low confidence" — which raises your FIR number but gives you more granular signal. A higher threshold means fewer flagged queries but a more conservative definition of failure. AskVio's default threshold is calibrated to flag answers below 50% confidence. Adjust it in the Data → Answer trust controls section of your dashboard if your use case demands a tighter or looser definition.
FIR and conversion rate: the relationship
FIR is a leading indicator of conversion rate, not a lagging one. When a user's intent fails, the most likely outcome is an exit — and exits that follow a failed intent are qualitatively different from exits that follow satisfied browsing. The user was actively trying to convert, found a blocker, and left.
This means FIR reduction has a direct, attributable path to conversion improvement. A 10-point reduction in FIR — achieved by adding five FAQ articles and sourcing two new SKUs — translates to fewer exits at high-intent moments. GA4 will register the conversion lift as a success. FIR explains why.
Reading FIR in AskVio's analytics dashboard
AskVio surfaces FIR data across four sections in the Analytics page of your dashboard. Here is how each section maps to the metric and what to look for in each.
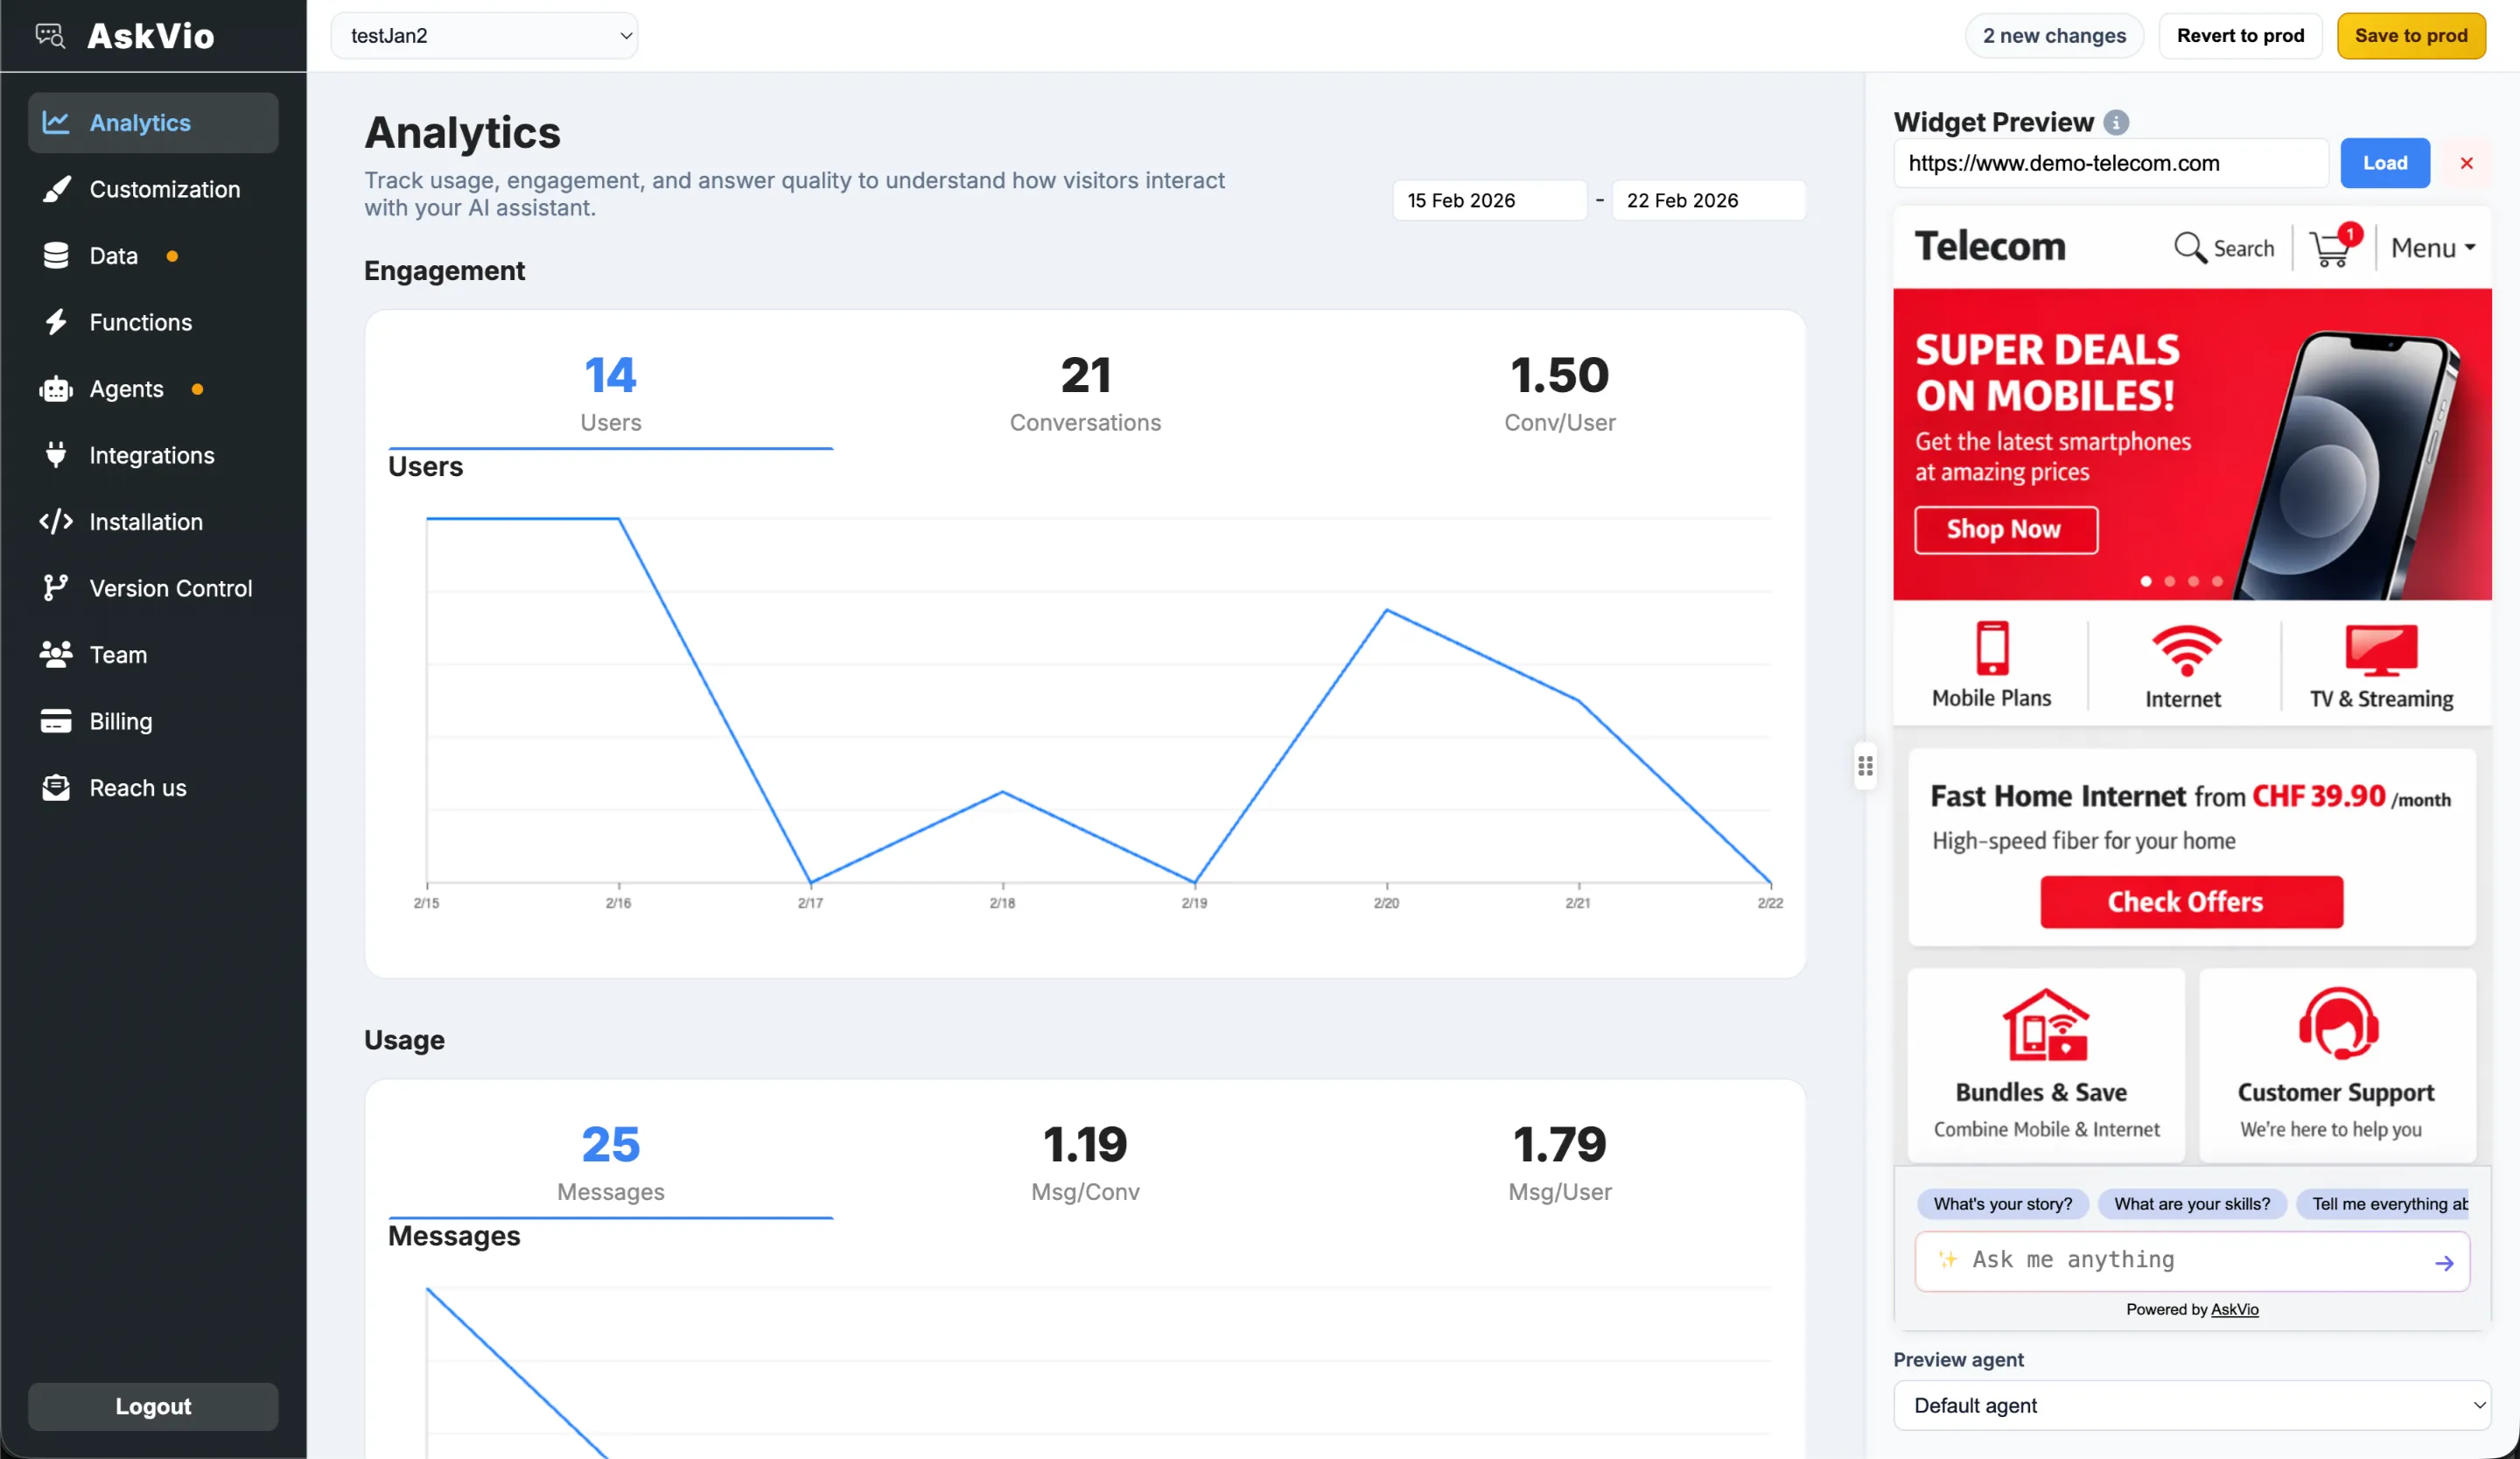
The AskVio Analytics dashboard — overview section with engagement, usage, and AI performance charts.
The Overview — Intelligence Brief and insight cards
When you open the Analytics section, the first thing you see is the Intelligence Brief — an AI-generated paragraph that summarises your period's intent data in plain language. It reads something like: "This week, 12% of queries received low-confidence answers. The top cluster was 'delivery time for rural areas', asked 28 times. Your catalog returned zero matches for 'waterproof trail shoes', asked 17 times by 14 distinct visitors."
Below the brief, four insight cards give you at-a-glance FIR numbers:
- Failed searches (red card) — the Content FIR component. Shows the count of low-confidence answer clusters for the period, plus the % of total queries they represent.
- Unmet demand (amber card) — the Catalog FIR component. Shows how many distinct product queries returned zero catalog matches.
- Top queries — the full volume picture. Helps you understand what the denominator of your FIR is and what queries are succeeding.
- Rising topics — week-on-week topic momentum. Use this to catch new FIR clusters before they grow large.
Each card is clickable and navigates directly to the detailed view for that component.
Failed Searches — the Content FIR table
The Failed Searches section shows every query cluster that the AI answered below your confidence threshold, ranked by frequency. Each row in the table includes:
- Query cluster — the AI-grouped version of multiple similar queries ("return window", "return period", "how long for returns" are clustered into one row)
- Asked — number of times this cluster was triggered in the period
- Avg. confidence — expressed as a percentage, with a visual bar. Below 30% is flagged in red.
- Last seen — when this query was last triggered. Useful for checking if a fix you deployed has stopped generating failures.
- Suggested action — the dashboard surfaces "Add FAQ" as the primary suggestion. Clicking it (when implemented) will create a pre-filled FAQ entry draft in your Data section.
A note on clustering: AskVio groups semantically similar queries into a single row rather than showing every individual phrasing. This means "can I return sale items", "return policy sale products", and "are discounted items returnable" appear as one cluster. This makes the table actionable — you write one FAQ, you fix all three phrasings at once.
Unmet Demand — the Catalog FIR cards
The Unmet Demand section uses a card layout rather than a table, because each gap deserves context beyond a row. Each card shows:
- The query that generated the gap (or the cluster centroid, if multiple similar queries are grouped)
- How many times it was asked and by how many distinct visitors
- The closest existing catalog match and its similarity score — so you can see whether you have something nearby ("73% similar: waterproof hiking boots — not trail-specific") or nothing at all (0% similarity)
- A note field where the AI adds context about what specifically the user seemed to want
The top card is marked as the highest-volume opportunity. In most cases, the top three cards in Unmet Demand represent the most commercially significant FIR signals — they are where revenue is most directly waiting on a catalog or sourcing decision.
Trending Topics — early warning for rising FIR
The Trending Topics section shows week-on-week volume change for query topic clusters. A topic rising sharply in queries does not automatically mean high FIR — but if a rising topic coincides with a cluster in your Failed Searches list, you have an emerging gap that is growing faster than you are fixing it. This is the early warning signal to act on before FIR climbs.
Acting on FIR data: a practical workflow
FIR data is only valuable if it generates action. The following workflow is designed for a weekly review cadence — 30 minutes, once a week, produces most of the improvement.
Review the Intelligence Brief (2 min)
Open Analytics in AskVio and read the Intelligence Brief for the past 7 days. Note the overall FIR percentage and the top two clusters. If FIR increased versus the previous period, the brief will highlight what drove the change.
Work through the top 5 failed searches (10 min)
Sort the Failed Searches table by volume (highest first). For each of the top 5 rows: check whether the content exists on your site. If it does, check that it is in a crawled URL. If the content is missing, add it — a FAQ entry in AskVio's Data section takes under 5 minutes. Trigger a recrawl after adding three or more entries.
Screenshot the top 3 Unmet Demand cards and send to the product/buying team (5 min)
Do not try to action catalog gaps yourself — escalate them with the data. A screenshot of the Unmet Demand card, showing query volume and visitor count, is a stronger business case than a verbal request. Include the top similarity score to show the team how close (or far) the existing catalog is from what users want.
Check Trending Topics for new emerging clusters (3 min)
Look at what is rising fastest this week. Cross-reference against the Failed Searches list — if the same topic appears in both, it is a growing gap that needs priority attention. If the rising topic is not in Failed Searches, it is a success: users are asking about something new and getting good answers.
Record FIR in your KPI log (2 min)
Paste the overall FIR percentage into a spreadsheet or your team's reporting tool alongside the date. Track it weekly. FIR improvement is often slow and non-linear — a content fix today may not register in the metric for 7–10 days as new conversations accumulate. Tracking it over time is the only way to see the trend.
What good looks like after 60 days: Teams that follow this workflow consistently typically see FIR drop from 35–45% (common on a freshly deployed widget) to under 15% within two months. The biggest gains come in the first two weeks — the content gaps that generated the most failures are usually obvious and fast to fix.
For agencies: FIR as a client deliverable
If you manage AI chat for multiple client sites, FIR is the metric that most directly justifies your retainer. Every other metric in the analytics stack — engagement, queries per session, response time — describes the widget's operational performance. FIR describes what your work is doing for the client's business.
Here is what a monthly FIR-led client report looks like in practice:
This report takes under 10 minutes to assemble from AskVio's dashboard. It contains three things that the client cannot get from any other source: the exact questions their customers asked this month, which ones went unanswered, and what product demand is going unmet. It is a different category of deliverable from a GA4 traffic summary.
For agency positioning, the framing matters. You are not delivering "chatbot analytics." You are delivering a monthly customer intelligence briefing. The widget is the collection mechanism. The report is the product.
A note on plan access: The Failed Searches, Unmet Demand, and Intelligence Brief features are available on Business and Agency plans. The Agency plan at $249/month supports up to 15 client sites — each with its own FIR data and intelligence view. If you manage multiple clients and plan to use FIR as a standard monthly deliverable, the Agency plan provides the most cost-effective path.
A note for MeasureCamp attendees
If you have found this post via MeasureCamp LA 2026, the core argument of this piece is what we will be discussing in the session. To recap the key points worth pressure-testing in the room:
- FIR and bounce rate are not substitutes. Bounce rate measures exit behavior. FIR measures intent failure. A page can have a low bounce rate and a high FIR if users get an answer and then leave satisfied — or it can have a high FIR because users failed to get an answer and gave up before bouncing. The metrics are independent.
- FIR is already measurable on any site with an AI chat widget. You do not need to build custom instrumentation. If the widget logs conversations and confidence scores (which AskVio does by default), you already have the raw data. The question is whether you surface it as a rate.
- The biggest objection is the denominator. FIR is only as meaningful as your query volume. On a low-traffic site with 50 queries per week, a 10% FIR represents 5 failed queries — statistically fragile. The metric becomes robust above roughly 300 queries per week. Below that threshold, focus on the absolute counts, not the percentage.
- FIR can be pushed into GA4. You can fire a custom event (
failed_intent) from the widget whenever the AI returns a low-confidence answer, and send it to GA4 like any other event. This lets you join FIR data with your existing GA4 segments, funnels, and audiences. We will walk through this integration in the session.
Conclusion
Failed Intent Rate fills a structural gap in behavioral analytics. It measures the space between what your visitors wanted and what your site delivered — a space that GA4, heatmaps, and exit surveys cannot see. It is actionable at the content level, at the catalog level, and as a client-facing deliverable for agencies. And it is available to any site running an AI chat widget that logs conversation confidence scores.
The measurement community has spent years making behavioral data more accurate, more granular, and more privacy-compliant. FIR is the natural next frontier: bringing intent data — the dimension behavioral tools structurally cannot capture — into the same rigorous, quantified, time-series measurement framework that the rest of analytics uses.
If you are running GA4 and you are not running FIR alongside it, you are measuring what your visitors do but not what they want. You are optimising the funnel you can see and ignoring the exits you cannot explain.
Those unexplained exits are trying to tell you something. FIR is how you listen.
See your own Failed Intent Rate
AskVio surfaces FIR automatically — no custom instrumentation, no data pipelines. Add the widget, let conversations accumulate, and your analytics dashboard fills in the gaps your GA4 never could.
Start free → Read the docs first